| Region | Inventory | vs 5-Yr Avg | vs Last Year |
|---|---|---|---|
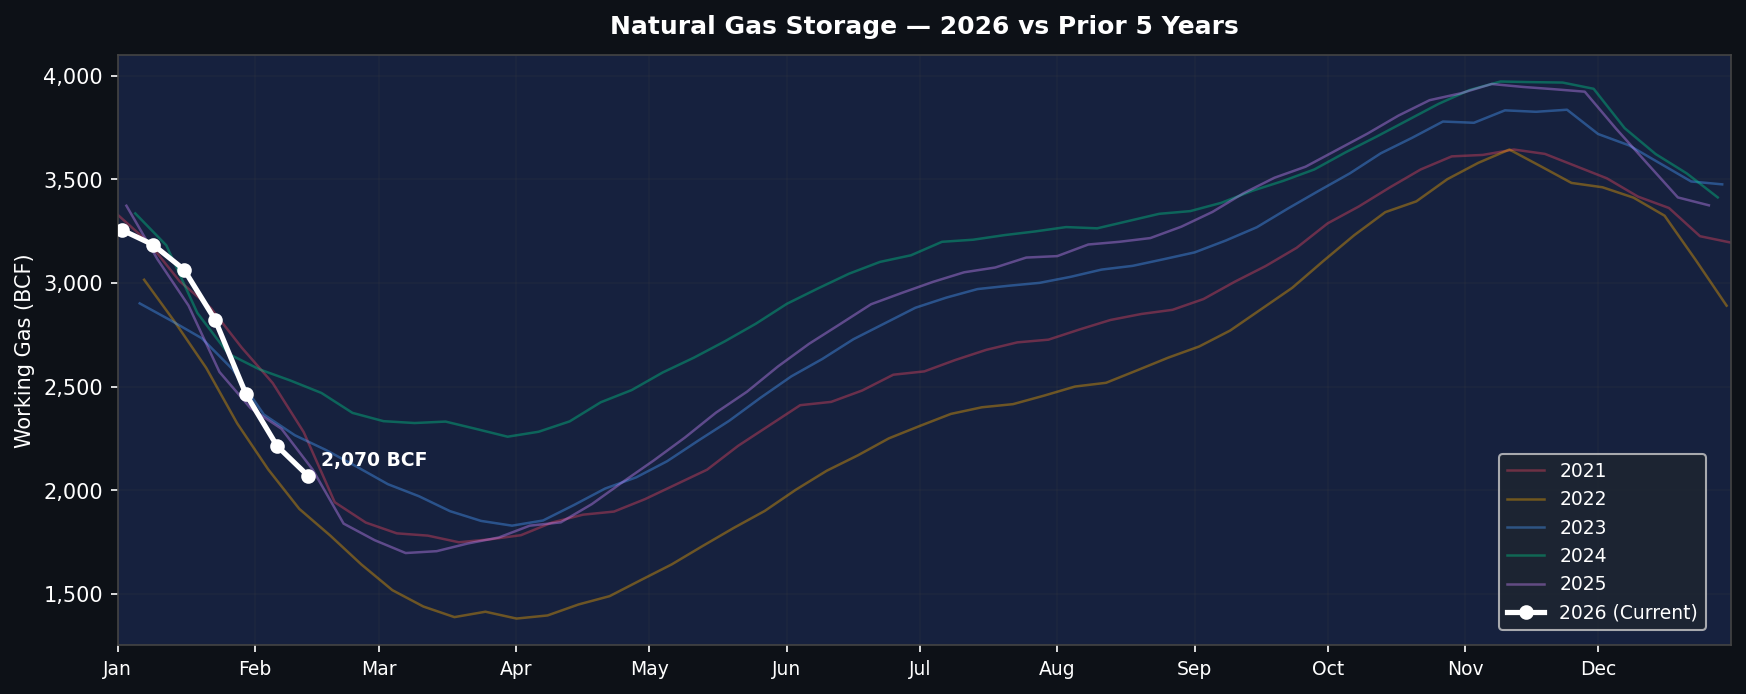
| East | 900 BCF | +24 BCF (+2.7%) | +3 BCF (+0.3%) |
| Midwest | 1,065 BCF | +21 BCF (+2.0%) | +9 BCF (+0.9%) |
| South Central | 1,125 BCF | -40 BCF (-3.4%) | -125 BCF (-10.0%) |
| Mountain | 257 BCF | +13 BCF (+5.3%) | -15 BCF (-5.5%) |
| Pacific | 297 BCF | +18 BCF (+6.5%) | -13 BCF (-4.2%) |
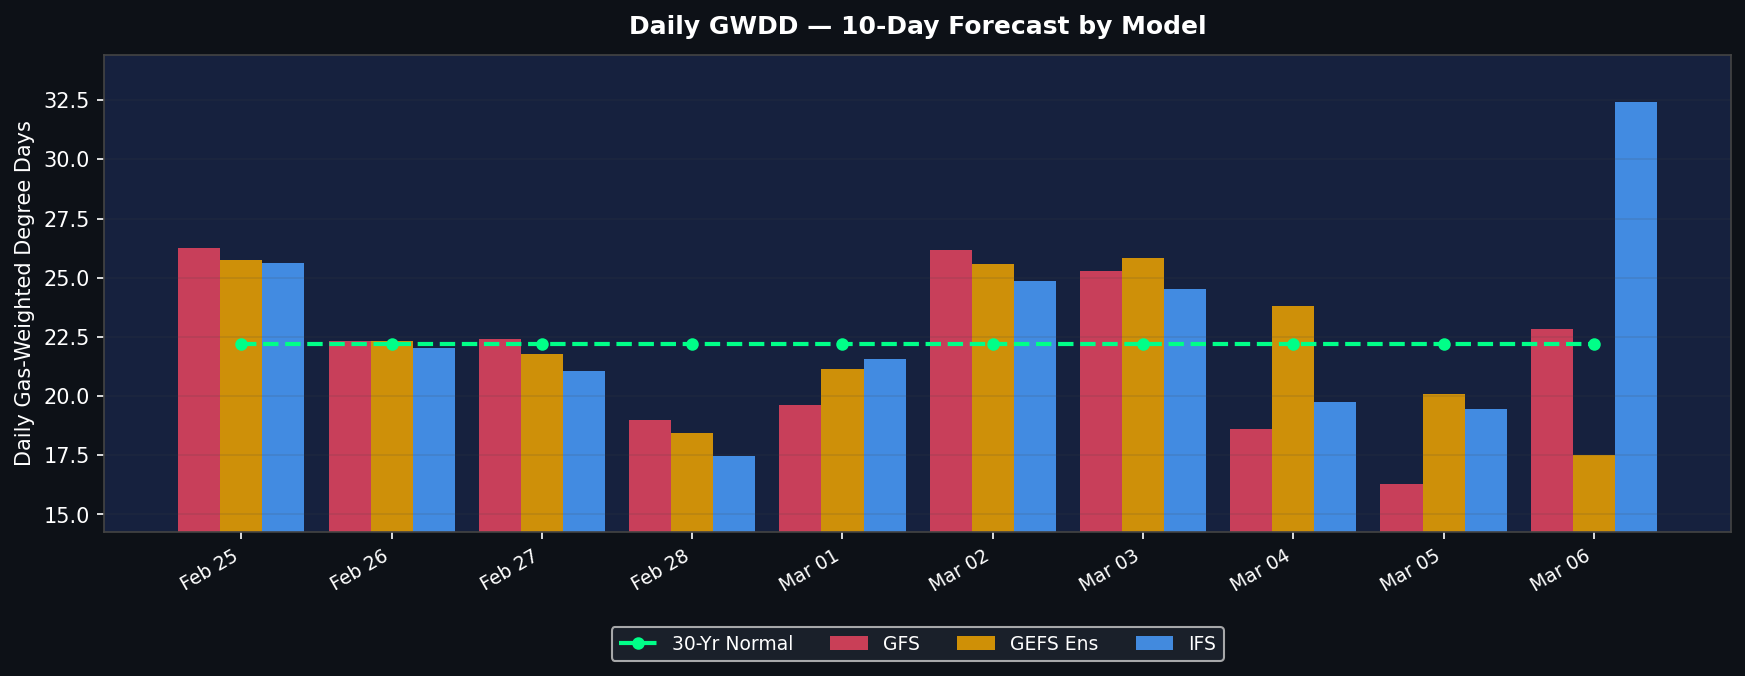
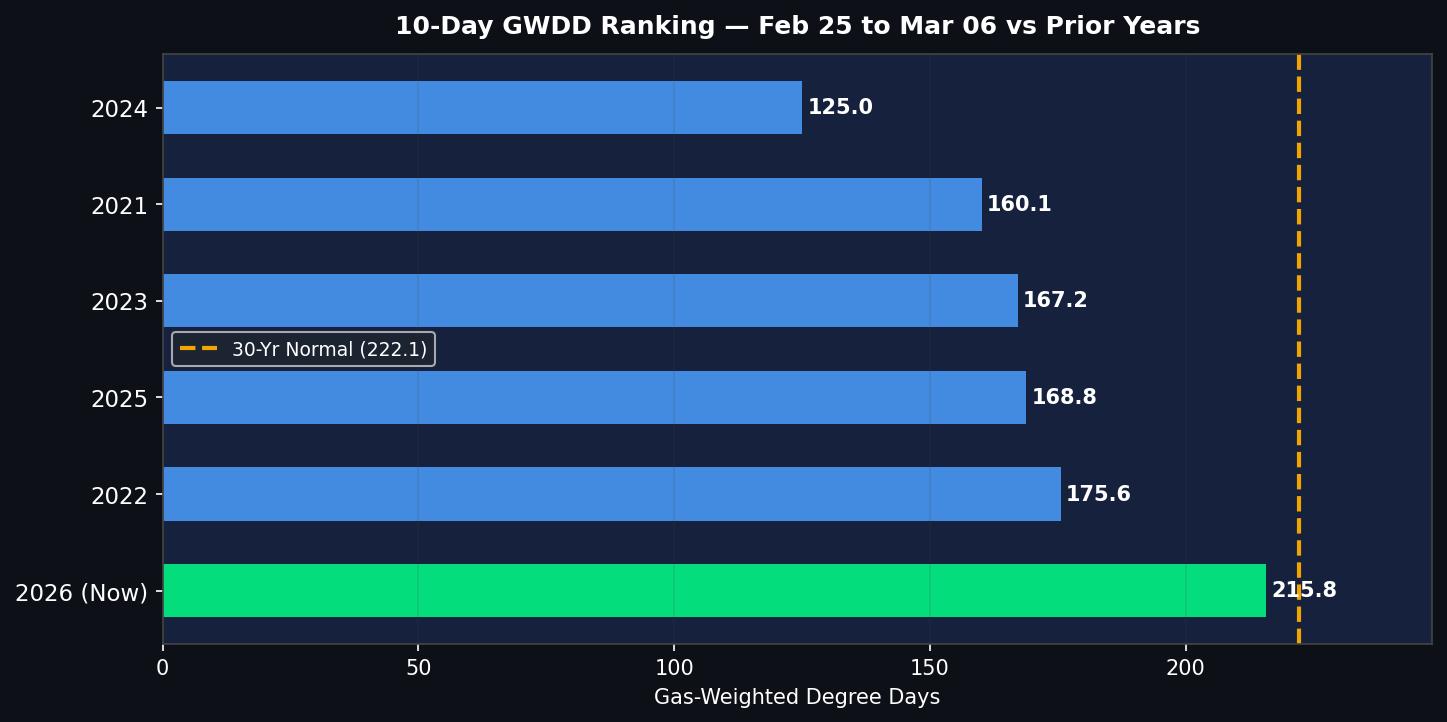
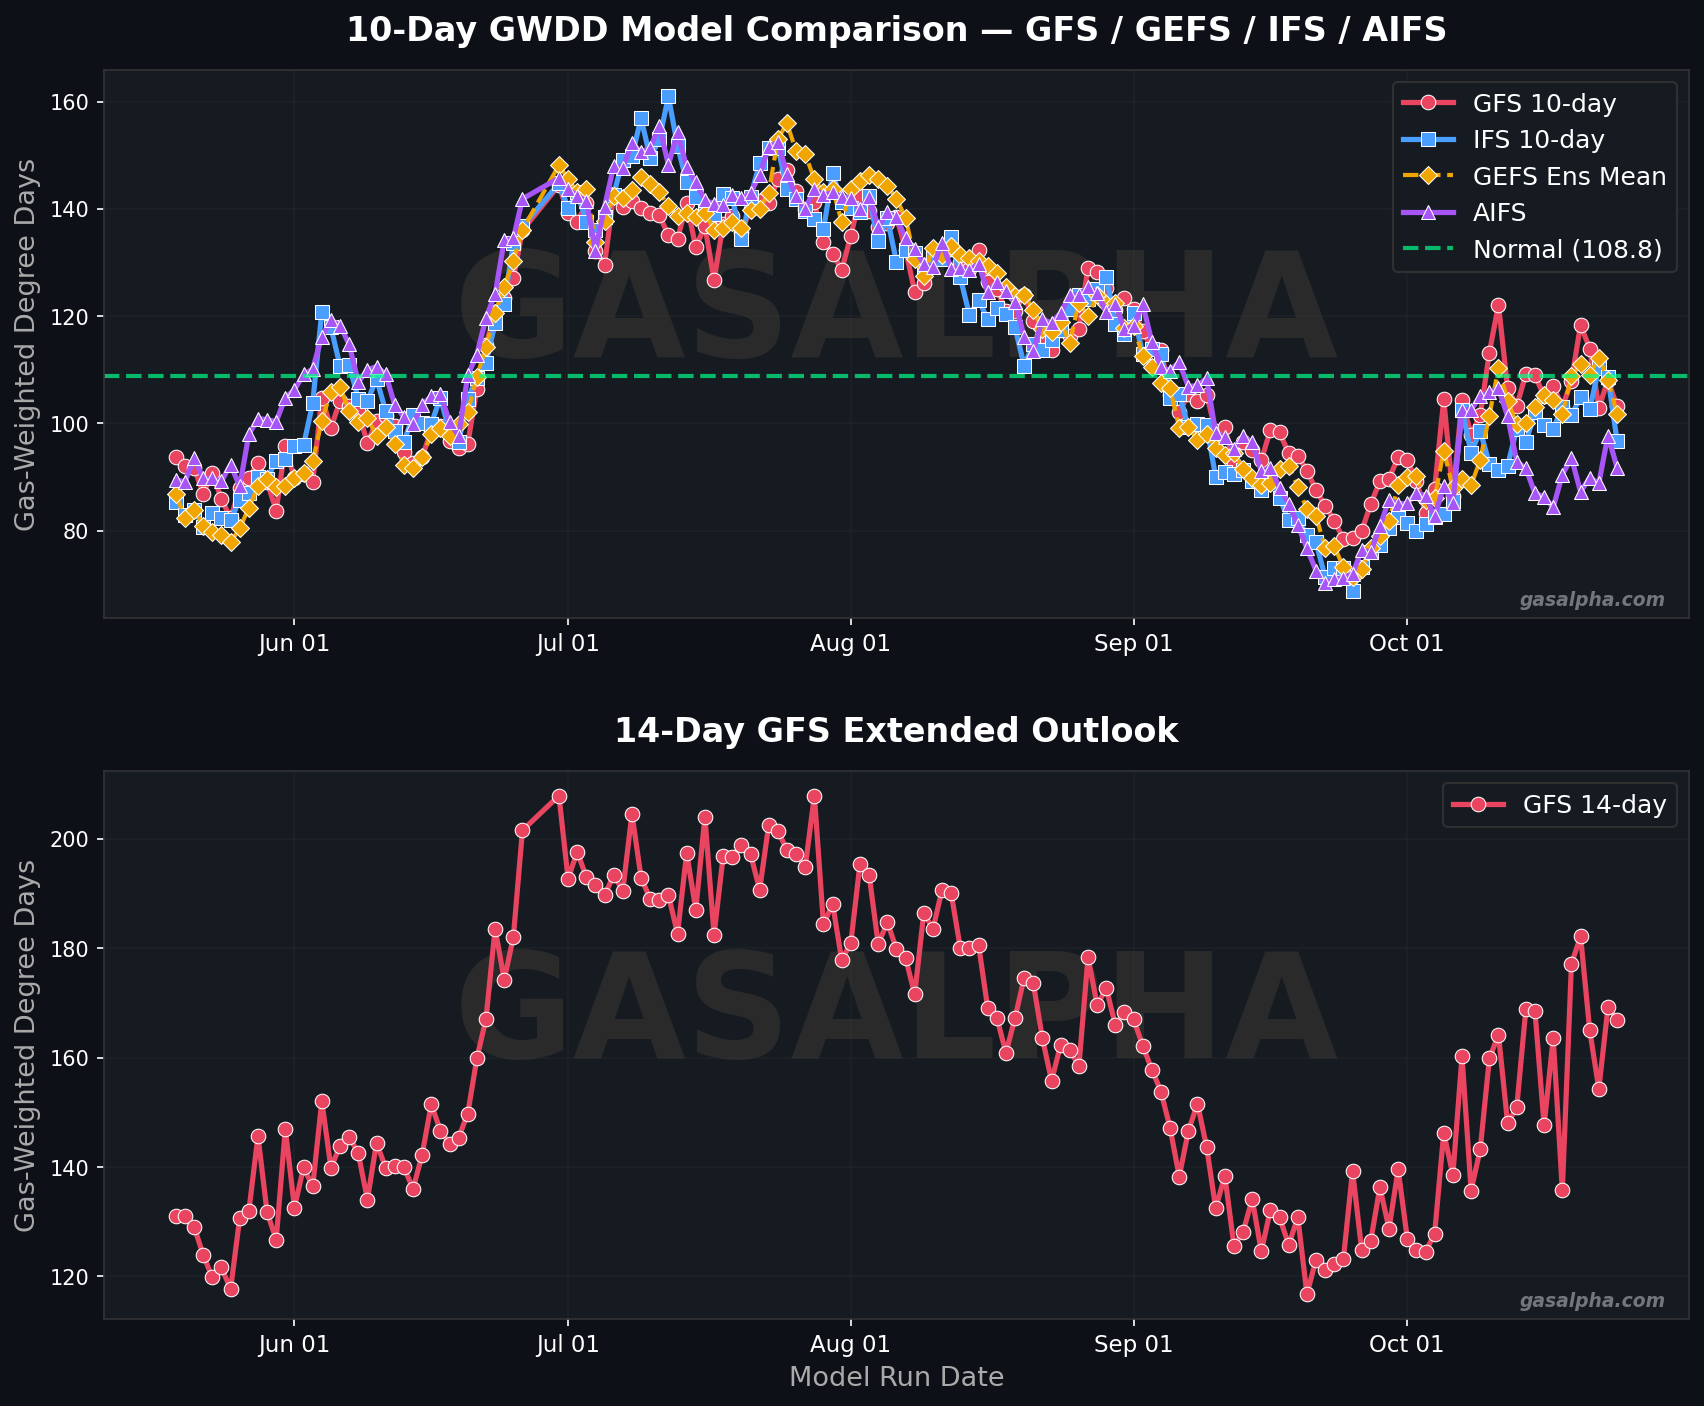
GasAlpha tracks Gas-Weighted Degree Days (GWDDs) from four weather models — GFS, ECMWF IFS, GEFS, and AIFS — updated four times daily. GWDDs weight temperature by regional natural gas consumption across the 9 EIA census divisions, making them a more accurate signal for storage draws and price moves than standard HDDs. The dashboard shows the 4-model consensus, historical rankings vs prior years, EIA storage comparisons, and forward curve context for natural gas traders. GasAlpha also tracks western US natural gas basis differentials, including EP San Juan, TW San Juan, SoCal Gas, PG&E Citygate, and Waha hub forward curves and historical percentiles. Used by natural gas traders, energy analysts, and commodity market participants to assess weather-driven demand, EIA storage trajectory, and price risk across Henry Hub and western basis markets. GasAlpha provides daily GWDD rankings vs prior years, EIA natural gas storage report analysis, weekly CFTC managed money positioning for natural gas futures, Henry Hub 12-month forward curve, and seasonal price history from 2021 to present. Key metrics include GFS vs ECMWF model spread, 4-model GWDD consensus, natural gas storage deficit vs 5-year average, storage vs last year comparison, and Henry Hub prompt price percentile ranking vs prior years. Natural gas weather forecasts updated 4 times daily at 5z, 9z, 13z, and 21z UTC. Natural gas trading requires accurate weather forecasts, real-time GWDD data, EIA storage analysis, and forward curve context — GasAlpha provides all of these in a single natural gas trading dashboard updated throughout the trading day. Natural gas traders use GWDDs to forecast EIA weekly storage draws and injections, anticipate Henry Hub price moves, and assess weather risk in natural gas futures and options markets. GasAlpha tracks the GFS weather model, ECMWF IFS weather model, GEFS ensemble, and AIFS model — the same models used by professional natural gas forecasters — and combines them into a single 4-model consensus GWDD figure updated four times daily. Disclaimer: GasAlpha is a weather and market data tool for informational purposes only. Weather models are probabilistic forecasts and are not guaranteed to be accurate. Nothing on this dashboard constitutes financial advice, investment advice, or a recommendation to buy or sell any commodity or financial instrument. All data should be independently verified before use in trading decisions.